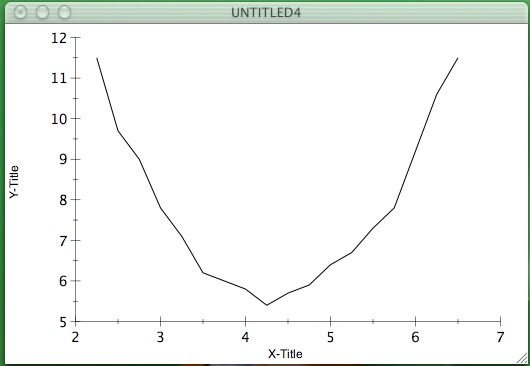
x-data y-data
2.25  11.5
2.5   9.7
2.75  9.0
3     7.8
3.25  7.1
3.5   6.2
4     5.8
4.25  5.4
4.5   5.7
4.75  5.9
5     6.4
5.25  6.7
5.5   7.3
5.75  7.8
6.25  10.6
6.5   11.5
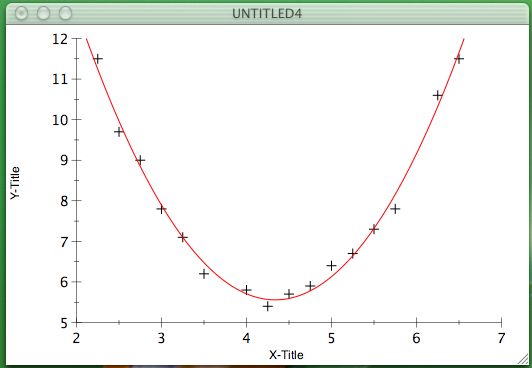
It looks like a parabola. Let's try to fit the parameters of a parabola.
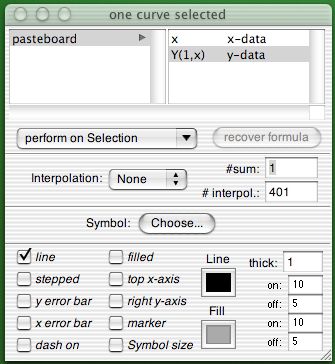
1. First you have to tell Abscissa which curve it should fit to. Click on the curve and the Browser Panel will show up. Choose the "mark as fit data" command from the pop-up-menu.
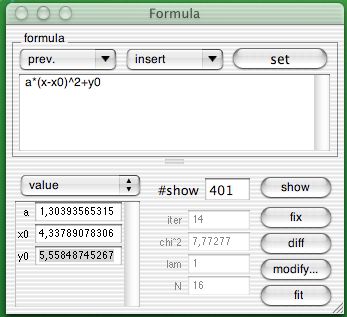
2. Open the Formula-Panel. Tool-Menu->Formula
3. Type the following formula in the text field
a*(x-x0)^2+y0and press the "set" button
4. The parameters are listed and should get start values. Fill the field with numbers: a=1; x0=1; y0=1
5. Click on the "fit"-button and you get the correct values. Other parameter properties as error and correlation are accessible with the pull down menu.
6. Click on the "show"-button to plot the fitted parabola
7. To make it look nicer click on the original curve and disable the "line"-switch in the Browser-Panel. Click on "Choose"-button and choose the "+" symbol.